What is Observability - Explained
What is Observability and why it's a necessary skill for software engineersWhile the literal meaning of Observability is the ability to observe (observe, ability), the root of the term originates from control theory, a branch of engineering and mathematics that deals with the behavior of dynamic systems with inputs.
In control theory, a system is considered observable if the current state of the system can be determined in finite time using only the output.
Put more simply:
Observability is the ability to infer the internal state of a system based on its external outputs.
When discussing Observability in the software realm, it could signify numerous things, as Observability is an overarching term which encompasses a wide spectrum of tools, practices, and concepts.
The term’s application in the software industry is still somewhat new. Although its roots in control theory date back to 1960, it only notably surfaced in the software sphere with Twitter’s 2013 article, Observability at Twitter.
As a simple guideline - if a tool enhances your understanding of your system’s internal state, it can likely be categorized as an Observability tool.
The Importance of Observability
As software becomes increasingly complex and distributed, the importance of Observability has never been more critical.
This is not just theoretical; these benefits are evident across the industry. For instance, the State of Observability 2023 Survey discovered that Observability leaders reported:
-
One third the number of outages per year as beginners
-
Launching 34% more products and revenue streams
-
Being four times as likely to resolved instances of unplanned downtime or serious service issues in just minutes, versus hours or days
This trend is also evident from the overall growth of the field. Once adopted, Observability becomes something that companies do not easily abandon.
Even without a proper observability solution in place, companies usually have some basic forms of Observability. Take log files for example:
Without a dedicated solution, these logs can be a nightmare to sift through (opposed to a centralized log solution, which has querying and visualizations capabilities)
The recognition that appropriate Observability is a must-have is something that is not yet fully ingrained in our industry.
A lot of developers wouldn’t consider it sensible to write code without tests, but they seem content with being oblivious to runtime errors that could crash their entire program. They might also lack alerts for critical issues, receiving notifications only when the issue has escalated and immediate resolution is required.
Observability is about providing the ability to easily and quickly access the state of your program and investigate what transpired when needed.
It’s also about being proactive - by monitoring and setting alerts, potential issues can be identified and addressed before they become a significant problem.
This raises the question: what exactly do you need to know about your program?
Different companies have different requirements, but it’s beneficial to be aware of the available solutions to better understand how to select your observability stack.
The Basics of Observability
All Observability tools share a common theme - they all revolve around sending out data , then analyzing that data.
Typically, this data is derived from production environments, where understanding the happenings is inherently more complex than when you’re developing in a local setting.
The nature of the data and the methods of analysis can drastically vary from one tool to another, each addressing a distinct goal.
The 3 Pillars of Observability
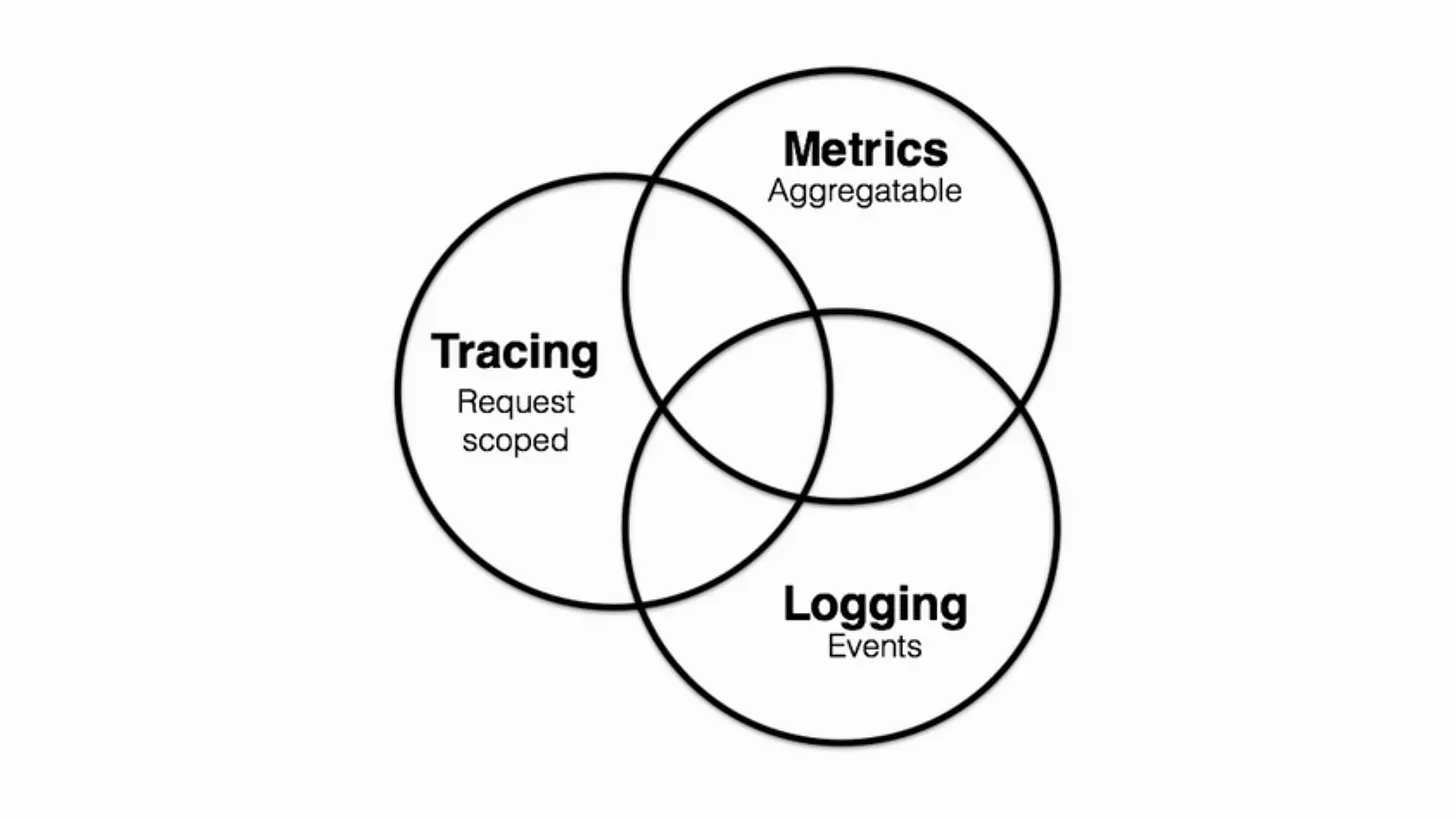
One concept that prominently stands out in the world of Observability is the three pillars of Observability, which are Logs, Metrics, and Traces.
You can think of these pillars as different types of data that you can send from a system, each with unique methods of analysis.
This concept primarily came into use after Twitter’s Four Pillars of Observability in 2016 (Observability at Twitter: technical overview, part I) In Peter Bourgeon 2017 article Metrics, tracing, and logging which maps Observability to 3 pillars in a Venn diagram
Logs
Logs are like a journal for your software, keeping account of events that happen while the software is running (e.g. Errors, informational messages, etc)
They offer information about what happened in a system. They’re often used to find past activity, or search for a problem by querying them, searching something like: Give me all Error logs WHERE service=orders AND error=SerializationError.
Tools such as Kibana allow you to create visualizations from your logs.
Metrics
Metrics are numerical representation of data, measured over time. They provide numerical data which can be analyzed to detect patterns, trends and potential issues.
Metrics can measure a variety of things, such as: Memory and CPU usage, Disk space, response time, processing rate.
They are often used for operational use-cases, with alerts setup on these metrics (e.g. Alert me if Disk Usage is over 80%, Alert me if median response time is over 200ms)
Tracing
Traces track the journey of a request as it passes through a system, recording the entire chain of events from start to finish.
Imagine having performance problems in a service that interacts with up to 5 services. How do you know if one of them is the bottle neck? With tracing, this information is instantly available to you.
It can also be used to track things like DB queries, or the time it takes to execute functions in the code.
Used together, they provide powerful tools to analyze the overall state of your system, investigate specific flows and understand how your system behaves over time.
Challenges of Observability
Observability doesn’t come without its set of challenges. There are two common categories of challenges you will likely encounter:
Technical Challenges
The first common type of challenge you’ll encounter is the technical one. Gaining the benefits from Observability requires picking and implementing specific tools, in a way that is beneficial to your use case.
The challenges vary from company to company, but the technical hurdle is something that can be overcome, and something this series plans to cover, so by the end of it you can have the information you need, and step by step guidance to actually implementing different Open-Source Observability tools on your own.
Challenges of Scale
The other common type of challenges are challenges of scale. This is where it becomes increasingly difficult to maintain an Observability infrastructure without the proper expertise, and one of the reasons many choose to subscribe to an Observability platform that charges them based on the data they send.
In one of the articles in the series we will cover implementing your own Observability vs using a paid platform, but managing Observability at scale is something I don’t intend to go into with this series.
Conclusion
In conclusion, Observability, with its roots in control theory, has become an indispensable tool in the software industry for understanding system states and detecting issues.
It encapsulates a wide range of tools, practices, and concepts, all aimed at giving you insights into your system.
Emphasizing the real-world benefits such as reduced outages and faster product launches, we’ve explored the essential three pillars: Logs, Metrics, and Traces, each serving unique and vital purposes.
While Observability presents both technical and scaling challenges, it offers immense benefits that make tackling these challenges worthwhile